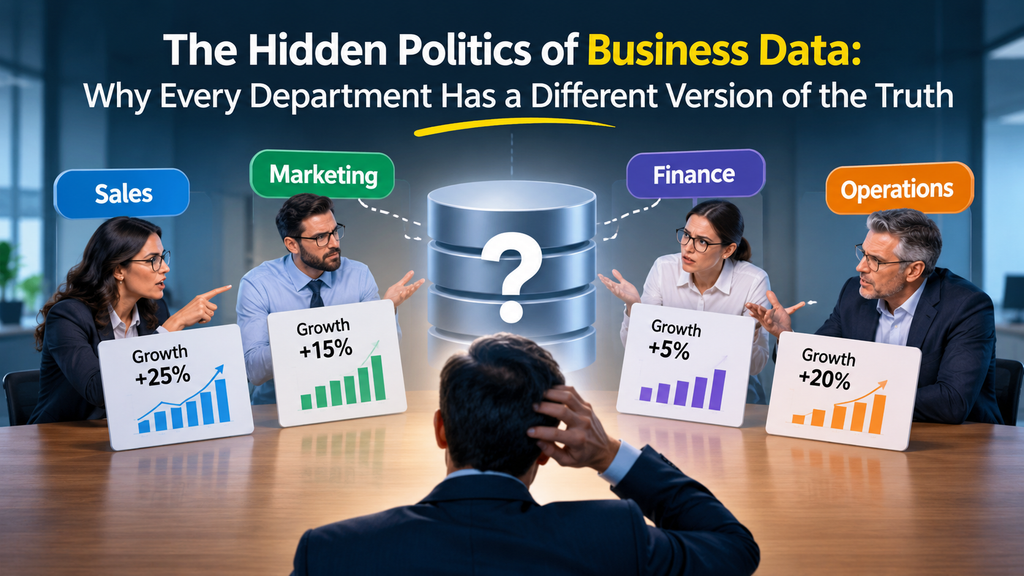
Business data silos have become one of the most overlooked challenges affecting modern enterprise decision-making. Organizations collect enormous amounts of information through customer relationship management (CRM) platforms, enterprise resource planning (ERP) systems, marketing automation tools, financial applications, and business intelligence dashboards. Although these technologies are designed to improve visibility and support better decisions, they do not always create a shared understanding of business performance. Business data silos often prevent organizations from connecting these different sources of information and developing a consistent view of their overall performance.
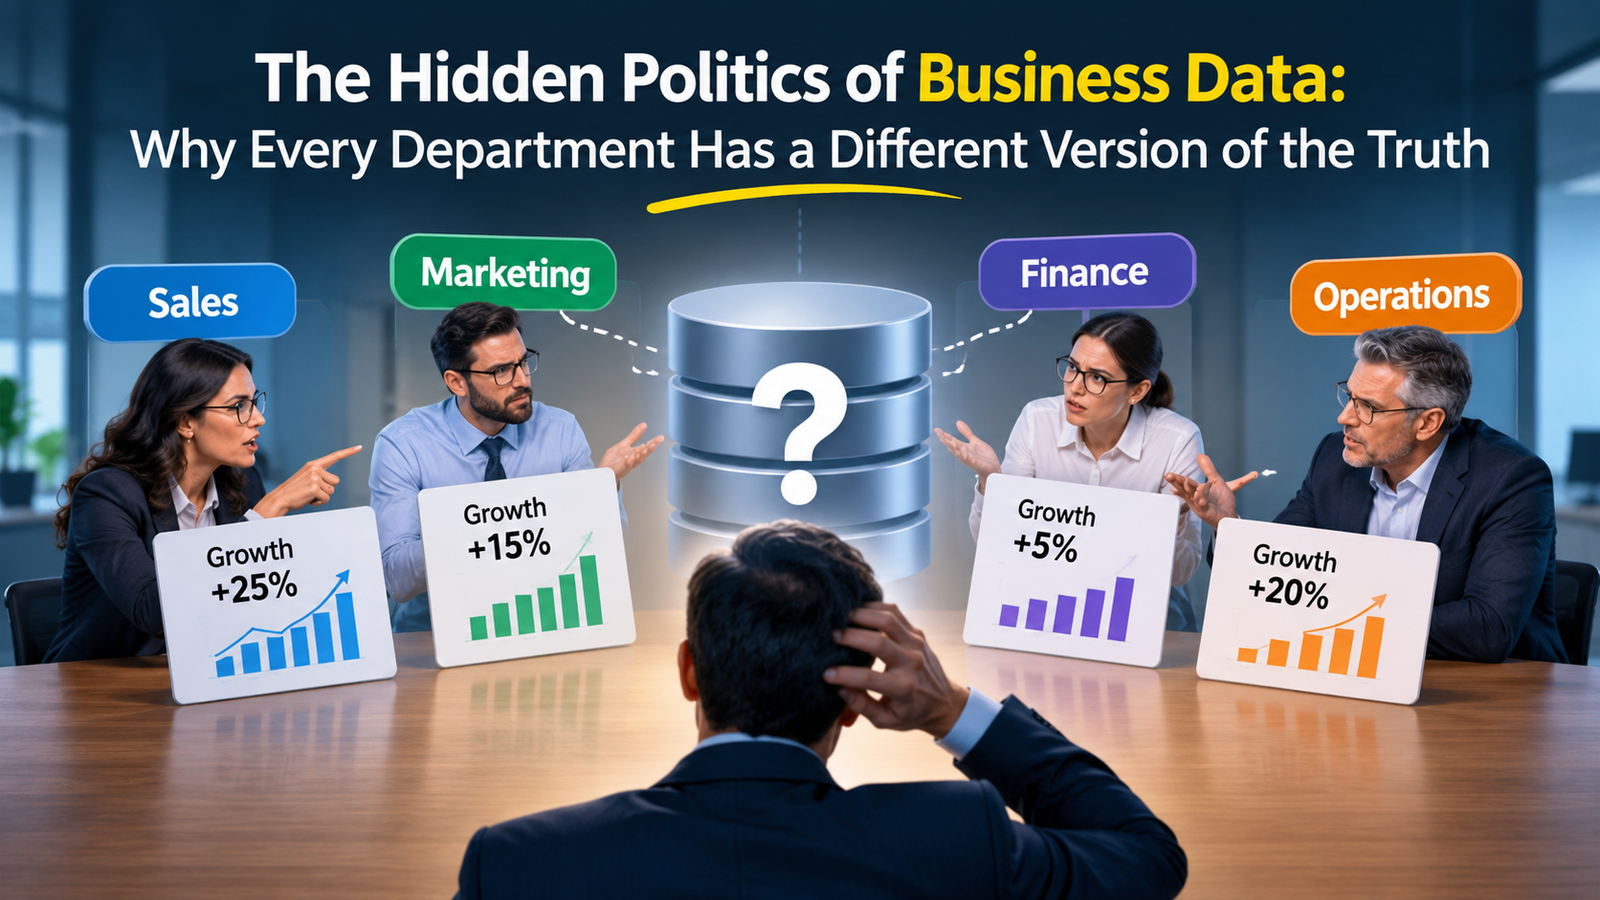
Consider a marketing campaign that generates thousands of website interactions and hundreds of enquiries. Marketing considers it successful because engagement and lead generation targets have been achieved. Sales, however, believes the campaign has underperformed because very few enquiries become qualified opportunities. Finance questions the investment because the revenue generated does not justify the expenditure, while senior management sees the campaign as a valuable contribution to brand awareness.
Interestingly, every department may have accurate information supporting its position. Yet, the organization still struggles to determine whether the campaign actually delivered business value. This disconnect reveals a deeper problem: data is not simply a tool for measuring performance. It can also influence departmental priorities, internal relationships, accountability, and strategic decisions.
Understanding why different departments interpret the same information differently is essential for building a connected, data-driven organization.
1. How Business Data Silos Create Different Versions of the Truth
Business data silos develop when information is collected, managed, and interpreted independently across departments without sufficient coordination. Each function builds its own reporting processes, measurement frameworks, and analytical practices based on its operational responsibilities.
While departmental reporting is necessary, problems emerge when these individual perspectives are treated as the complete picture of organizational performance.
For example, a sales team might use its CRM platform to track opportunities and revenue forecasts, while marketing relies on campaign analytics to measure engagement and lead generation. Finance may maintain separate spreadsheets or financial systems to evaluate expenditure and profitability. Each platform provides valuable information, but connecting these datasets can become difficult when systems, reporting periods, and measurement definitions differ.
As a result, leadership may receive multiple reports describing the same business activity without having a consistent understanding of its actual impact.
Common consequences of disconnected business data include:
- Conflicting performance reports: Different departments present numbers that appear inconsistent because they use different data sources or calculation methods.
- Limited organizational visibility: Leadership struggles to understand how individual departmental activities contribute to broader business objectives.
- Duplicated reporting efforts: Employees spend time collecting, cleaning, and reconciling information that may already exist elsewhere.
- Delayed decision-making: Management discussions become focused on validating numbers instead of identifying opportunities and solving problems.
- Reduced accountability: Departments can disagree about performance ownership when information is incomplete or inconsistently defined.
The real challenge is not necessarily the accuracy of individual reports. It is the absence of a connected framework that explains how those reports relate to one another.
2. How Business Data Silos Influence Departmental KPIs and Priorities
One of the biggest reasons organizations experience conflicting interpretations of data is that departments are evaluated through different key performance indicators (KPIs).
Every business function has specific responsibilities, and its employees are measured according to how effectively they achieve those objectives. These measurements are important, but they can create unintended conflicts when departmental success is disconnected from overall organizational performance.
Consider how different departments evaluate business performance:
- Marketing: Website traffic, campaign engagement, brand visibility, lead generation, and marketing-qualified leads.
- Sales: Sales-qualified leads, opportunity conversion rates, deal values, customer acquisition, and revenue contribution.
- Finance: Operational expenditure, profitability, budget utilization, cash flow, and return on investment.
- Human Resources: Employee retention, recruitment efficiency, workforce productivity, and talent development.
- Operations: Process efficiency, service delivery, resource utilization, operational costs, and productivity.
These indicators measure different aspects of business performance. However, they can become problematic when employees prioritize individual targets over shared organizational outcomes.
The Marketing and Sales Alignment Problem
Marketing may prioritize generating a higher volume of enquiries because lead generation directly influences campaign performance. Sales, on the other hand, may prefer fewer but more relevant opportunities because its performance depends on successful conversions and revenue generation.
For example, marketing might report that a campaign generated 500 enquiries, while sales identifies only 40 as genuinely qualified opportunities.
Marketing may highlight the campaign’s reach and engagement, whereas sales may question the relevance of the audience being targeted.
Neither department is necessarily wrong. The disagreement develops because both teams are evaluating different stages of the customer acquisition process.
A more connected measurement approach would evaluate:
- Lead generation volume and lead quality.
- Marketing-qualified lead (MQL) to sales-qualified lead (SQL) conversion.
- Opportunity creation and pipeline contribution.
- Customer acquisition cost.
- Revenue generated through marketing-supported opportunities.
When departments share responsibility for business outcomes, performance measurement becomes more meaningful than simply achieving individual targets.
3. Different Data Definitions Lead to Different Business Decisions
Another significant contributor to business data silos is the absence of standardized definitions for important business terms and performance indicators.
Organizations frequently use the same terminology across departments while assigning different meanings to it.
A lead, for example, might refer to anyone who submits a website form from the marketing team’s perspective. Sales may consider a lead valuable only when the individual demonstrates genuine buying interest. A CRM platform may classify someone as qualified only after specific demographic, organizational, or behavioral requirements have been satisfied.
These differences can create reporting inconsistencies even when every department uses the same underlying customer information.
Other examples include:
- Customer: Marketing may count every registered user, while finance recognizes only customers who generate billable revenue.
- Project completion: Operations may consider a project complete after delivering the agreed output, while leadership evaluates completion based on the achievement of expected business outcomes.
- Revenue: Sales may report the value of signed contracts, while finance recognizes revenue according to applicable accounting policies.
- Employee productivity: HR may evaluate performance through workforce indicators, while department managers focus on completed deliverables and operational efficiency.
Why Common Data Definitions Matter
Standardized data definitions help organizations establish consistency across reporting systems and departmental workflows.
A shared business glossary can document important terms, measurement rules, calculation methods, and reporting responsibilities.
Organizations should establish:
- Clearly documented definitions for business-critical metrics.
- Consistent calculation methods across reporting platforms.
- Standardized data collection and classification practices.
- Defined ownership for maintaining important datasets.
- Regular reviews to identify outdated or conflicting reporting rules.
Without these foundations, introducing additional dashboards or analytics platforms may simply increase the number of reports without improving decision-making.
4. The Human Side of Data: When Reporting Becomes Departmental Politics
Business data is often presented as objective information, but the way people interpret and communicate it is influenced by organizational responsibilities, performance expectations, and professional relationships.
Employees are not always neutral observers when the results being discussed directly affect their departmental reputation or individual performance evaluations.
For example, when a marketing campaign underperforms, the marketing team may emphasize changing audience behavior, market conditions, or insufficient campaign budgets. When the sales pipeline weakens, sales leaders may point toward poor lead quality or limited marketing support.
Similarly, operations teams may explain rising expenditure through additional resource requirements, unexpected workloads, or changing business priorities.
These explanations may be completely legitimate. However, problems arise when discussions become focused on defending departmental performance rather than understanding the underlying business issue.
How Data Becomes a Tool for Internal Positioning
In organizations without strong data transparency and accountability, reporting meetings can gradually become exercises in defending individual functions.
This behavior may appear in several ways:
- Teams highlight metrics that support their performance while overlooking unfavorable indicators.
- Departments challenge measurement methods when the results do not support their expectations.
- Employees hesitate to share incomplete or unfavorable information because they fear additional scrutiny.
- Teams prioritize reporting success over identifying operational weaknesses.
- Managers spend more time explaining conflicting numbers than developing corrective actions.
Over time, this creates an environment where information becomes a source of internal competition rather than a shared organizational resource. These internal conflicts can make business data silos even more difficult to resolve because departments become protective of their individual reporting processes and performance measurements.
The solution requires leadership to establish a culture where reporting is intended to improve business understanding, not assign blame. Employees should feel comfortable discussing performance gaps, identifying weaknesses, and presenting different interpretations without turning every disagreement into a departmental conflict.
5. Why Artificial Intelligence Cannot Fix Poor Data Alignment Alone
Artificial intelligence and advanced analytics are transforming how enterprises collect, process, and interpret business information.
AI-powered platforms can analyze large datasets, identify patterns, generate forecasts, summarize business performance, and recommend potential actions. These capabilities can significantly improve organizational visibility when the underlying information is reliable and properly structured.
However, AI cannot automatically resolve inconsistencies created by disconnected departmental processes. Addressing business data silos is therefore an important prerequisite for organizations planning to implement reliable AI-powered analytics and enterprise decision-making systems.
Consider an organization that uses separate platforms for marketing automation, sales management, financial reporting, and operational planning. If these systems contain incomplete records, inconsistent definitions, or outdated information, an AI-powered analytics platform may generate recommendations based on an incomplete representation of business performance.
For example:
- A marketing forecasting model may predict strong campaign performance without considering sales conversion feedback.
- A sales forecasting system may overestimate revenue because opportunity stages are inconsistently maintained.
- An operational analytics platform may underestimate project expenditure because certain costs are recorded in a separate financial system.
- An AI-powered management dashboard may present conflicting performance summaries because different departments use different definitions for the same metrics.
The danger is that AI-generated recommendations can appear highly authoritative even when their underlying information is incomplete.
Building an AI-Ready Enterprise Data Foundation
Before implementing advanced analytics and AI-powered decision-making systems, businesses should focus on establishing reliable data foundations.
Important priorities include:
- Data integration: Connect relevant business applications so information can be accessed across departmental boundaries.
- Data quality management: Identify incomplete, outdated, duplicated, and inconsistent records.
- Data governance: Establish clear policies for data ownership, access, security, and maintenance.
- Metric standardization: Ensure that AI systems use consistent definitions and calculation methods.
- Human oversight: Allow business experts to review AI-generated insights and evaluate whether recommendations reflect actual organizational conditions.
AI can improve the speed and depth of business analysis, but its effectiveness depends on the quality and context of the information it receives.
6. Seven Practical Ways to Break Business Data Silos
Resolving business data silos requires more than introducing another reporting platform. Organizations need to improve how departments collect, share, interpret, and manage information across the enterprise. A structured approach can help businesses establish consistent reporting practices and improve cross-functional decision-making.
The following practices can help enterprises establish a more consistent approach to business intelligence and organizational decision-making.
1. Establish a Shared Business Data Framework
Organizations should create a common framework for managing business-critical information across departments.
This framework should define important performance indicators, reporting requirements, data sources, and calculation methods.
For example, marketing and sales should agree on what constitutes a qualified lead, when ownership transfers between teams, and how lead-to-revenue performance is measured.
A shared framework reduces confusion and creates a consistent foundation for business reporting.
2. Integrate Departmental Business Systems
Disconnected software platforms often contribute to fragmented reporting.
Enterprises should evaluate opportunities to connect their CRM, ERP, HR, marketing automation, financial management, and operational systems.
Integration can help organizations establish a more complete view of business activities without requiring employees to manually reconcile information from multiple platforms.
Depending on the technology environment, this may involve APIs, enterprise integration platforms, data warehouses, or centralized data platforms.
3. Introduce Strong Data Governance Practices
Data governance establishes how business information is defined, managed, protected, and maintained.
Organizations should assign ownership to critical datasets and establish clear responsibilities for maintaining data quality.
A practical data governance framework should address:
- Data ownership and stewardship.
- Access permissions and security controls.
- Data classification and standardization.
- Data quality monitoring.
- Reporting policies and documentation.
- Compliance and retention requirements.
These practices help organizations maintain trustworthy information across departments.
4. Align Departmental KPIs With Organizational Objectives
Departmental performance indicators should contribute to broader business outcomes rather than operate independently.
Marketing and sales, for example, can jointly measure pipeline contribution, conversion performance, and customer acquisition costs.
Similarly, finance and operations can collaborate to evaluate project profitability, resource efficiency, and long-term operational value.
This does not mean eliminating department-specific KPIs. Instead, organizations should connect individual measurements to shared business objectives.
5. Create Cross-Functional Reporting Processes
Regular reporting discussions should bring relevant departments together to evaluate shared business outcomes.
Rather than reviewing isolated departmental dashboards, organizations can introduce cross-functional performance reviews.
For example, a quarterly business review could examine how marketing investment influences sales opportunities, how sales performance affects revenue forecasts, and how operational requirements influence profitability.
This encourages teams to evaluate the complete business process rather than focusing exclusively on individual departmental results.
6. Invest in Data Literacy Across the Organization
Technology alone cannot establish a consistent data culture.
Employees and managers should understand how business metrics are calculated, what they represent, and how they should influence decisions.
Data literacy initiatives can help employees:
- Interpret dashboards and analytical reports.
- Understand the limitations of different data sources.
- Recognize misleading comparisons and inconsistent metrics.
- Ask better questions about business performance.
- Communicate insights across departmental boundaries.
When employees share a common understanding of business information, discussions become more productive and decisions become easier to justify.
7. Measure Shared Business Outcomes Instead of Isolated Success
The most important step is to establish accountability for outcomes that require collaboration between departments.
For example, a marketing campaign should not be evaluated exclusively through impressions, clicks, or enquiries. Its performance should also be considered in relation to qualified opportunities, pipeline contribution, customer acquisition, and revenue impact.
Similarly, operational efficiency should be evaluated alongside service quality, customer experience, and financial performance.
Organizations that connect departmental performance to shared business outcomes are better positioned to identify problems, improve processes, and make informed strategic decisions.
7. What Business Leaders Should Do to Build a Unified Data Culture
Breaking business data silos is not exclusively an IT responsibility. It requires active involvement from executive leadership, department heads, technology teams, and business stakeholders.
Leaders must recognize that different interpretations of information are not always signs of poor performance. They can reveal gaps in organizational processes, measurement frameworks, and communication.
A unified data culture begins when leadership encourages departments to share information, challenge assumptions constructively, and focus on collective business objectives.
Some important leadership priorities include:
- Promote transparency: Make relevant business information accessible to authorized stakeholders across departments.
- Encourage collaboration: Establish shared responsibilities for business outcomes that depend on multiple functions.
- Reward meaningful results: Recognize contributions to organizational performance rather than focusing exclusively on isolated departmental targets.
- Invest in reliable infrastructure: Support data integration, governance, analytics, and reporting capabilities.
- Encourage evidence-based discussions: Ask teams to explain the context behind their numbers instead of accepting individual metrics without further examination.
Leadership should also recognize that not every difference in reporting represents an actual data error. Some differences arise because departments measure distinct stages of the same business process.
The objective is not to force every department to use identical performance indicators. It is to ensure that different measurements contribute to a consistent understanding of organizational performance.
Conclusion
The biggest data challenge facing modern enterprises may not be a shortage of information, but the absence of a shared understanding of what that information actually means.
Organizations continue investing in business intelligence platforms, AI-powered analytics, automated dashboards, CRM systems, and enterprise data infrastructure. Yet, these investments cannot deliver their full value when departments operate with disconnected priorities, inconsistent definitions, and competing interpretations of business performance.
Addressing business data silos requires a combination of technology, governance, collaboration, and organizational change.Breaking business data silos requires organizations to connect technology, people, and performance objectives through a common data management strategy.Companies must establish common measurement frameworks, integrate business systems, improve data quality, and encourage departments to evaluate performance through shared objectives.
Most importantly, leadership must create an environment where information supports collective problem-solving rather than departmental positioning.
The future of enterprise decision-making will not necessarily belong to organizations that collect the largest volumes of data or implement the most advanced analytics platforms. It will belong to those that can connect information across departments, understand different business perspectives, and turn those perspectives into better decisions.
Because sometimes, the biggest problem with business data is not that the numbers are wrong. It is that everyone believes their interpretation is the only one that matters.